Worked lane example
What does a Nuremberg–Birmingham Mega trailer actually cost?
Four carriers quoted the same lane in the same week against the same specification. The spread between the lowest and the highest was €1,075 a load. This brief rebuilds the lane from the road up — fuel, labour, tolls, asset cost and waiting time — and shows which quotes the road explains and which it does not.
The short answer
The modelled should-cost for a Nuremberg to Birmingham Mega trailer movement is €2,921 per trip, or €2.435 per loaded kilometre, on a German-driver labour base and August 2026 fuel. Two of the four quotes received sit within 2% of that figure and are credible as received. Carrier 3 is 19.8% above the model and Carrier 4 is 35.2% above — a €1,029 premium that exceeds the entire fuel bill for the trip.
What assumptions is the lane costed on?
| Input | Value used in the model |
|---|---|
| Origin → destination | Nuremberg (DE) → Birmingham (UK), Channel crossing by Eurotunnel |
| Lane distance | 1,200 km loaded (planner distance 1,188 km; truck-routed 1,130 km) |
| Empty running | 100 km — 50 km pre-haul, 50 km after tipping → 1,300 effective km |
| Equipment | Mega curtainsider semi-trailer · 100 m³ · 33 pallets · 24 t payload · 3 years old |
| Labour base | German driver · 2.5 driver days · per diem applied separately |
| Fuel | €2.20 / litre (August 2026 basis) · 29.9 l/100 km · 388 litres per trip |
| Loading / unloading | 2 hours + 2 hours |
| Waiting | 5.0 hours — border, urban congestion, terminal dwell · 2 h free, 3 h chargeable |
| Tolls | Auto-calculated from the routed path (DE · BE · FR) + €352 Channel crossing |
| Speed band | Long range · 80 km/h planning speed |
| Routing engine | OpenStreetMap · Valhalla, truck profile |

How did the four carrier quotes compare?

| Source | € / trip | € / loaded km | € / pallet | vs should-cost |
|---|---|---|---|---|
| Frintelis should-cost | 2,921 | 2.435 | 88.53 | benchmark |
| Carrier 1 | 2,875 | 2.396 | 87.12 | −1.6% |
| Carrier 2 | 2,925 | 2.438 | 88.64 | +0.1% |
| Carrier 3 | 3,500 | 2.917 | 106.06 | +19.8% |
| Carrier 4 | 3,950 | 3.292 | 119.70 | +35.2% |
| Field average | 3,313 | 2.760 | 100.38 | +13.4% |
What the comparison shows
- Fuel, labour and tolls carry 77% of the cost. €2,263 of the €2,921 is road cost that any compliant carrier on this lane has to absorb. The commercial conversation really concerns the remaining €658 of asset, overhead and margin — a much narrower argument than the €1,075 spread suggests.
- Two quotes are already at benchmark. Carrier 1 (−1.6%) and Carrier 2 (+0.1%) are consistent with a German-driver cost base and the routed toll path. They are credible rather than cheap, and need no further discount to be defensible internally.
- €1,029 of the top quote is unexplained. Carrier 4's premium is larger than the entire fuel bill for the trip (€867) and 6.6 times the full waiting and detention cost (€155).
On 100 loads a year, awarding at the benchmark-consistent quote (€2,875) instead of the field average (€3,313) is worth €43,750. Against the highest quote in the field it is €107,500.
Where does the money actually go?

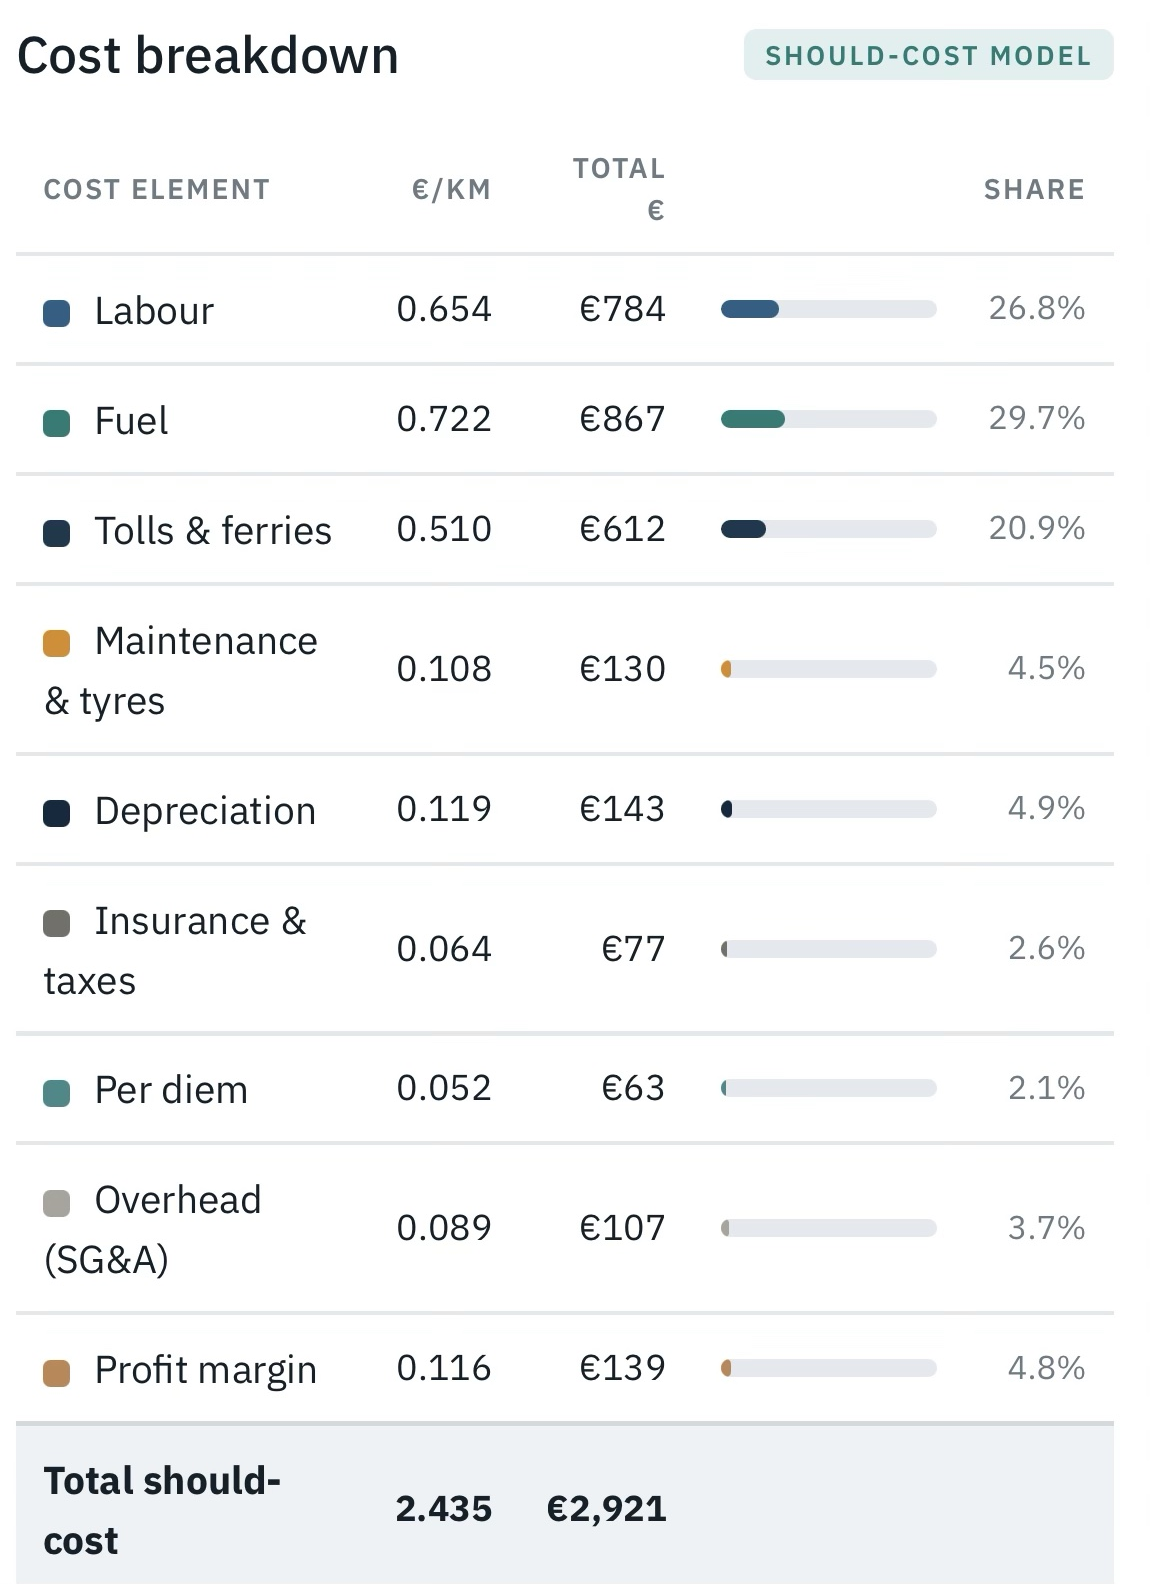
| Cost element | € / km | € / trip | Share |
|---|---|---|---|
| Fuel (including idling) | 0.722 | 867 | 29.7% |
| Labour — German driver | 0.654 | 784 | 26.8% |
| Tolls & Channel crossing | 0.510 | 612 | 20.9% |
| Depreciation | 0.119 | 143 | 4.9% |
| Profit margin | 0.116 | 139 | 4.8% |
| Maintenance & tyres | 0.108 | 130 | 4.5% |
| Overhead (SG&A) | 0.089 | 107 | 3.7% |
| Insurance & taxes | 0.064 | 77 | 2.6% |
| Per diem | 0.052 | 63 | 2.1% |
| Total should-cost | 2.435 | 2,921 | 100% |
Reading the stack
- Fuel €867 — 388 litres at €2.20/l, including €13 of idling fuel burned during the five-hour wait. A 10% fuel move is worth €90 a trip: index the fuel component rather than re-tendering the lane.
- Labour €784 plus €63 per diem — a German driver across 2.5 driver days. The establishment country behind the labour base is the single largest structural lever on this lane and should be stated, not assumed.
- Tolls and crossing €612 — €352 of it the Eurotunnel booking. Verifiable pass-through, and worth ring-fencing in the contract.
- Asset and overhead €457 — depreciation, maintenance, tyres, insurance, taxes and SG&A on a three-year-old Mega trailer.
- Margin €139 (4.8%) — the carrier profit assumption in the model. Two points of margin are worth €54 a trip.
What could move the number?

| Variable | Base input | Test range | Commercial question |
|---|---|---|---|
| Waiting and dwell | 5.0 h (2 h free) | 0 to +8 h | What is included, and when does detention begin? |
| Fuel | €2.20 / litre | −10% to +10% | Which index, baseline and adjustment frequency apply? |
| Channel crossing | €352 fixed | €300 to €450 | Is the crossing fixed, passed through or carrier-managed? |
| Empty running | 100 km (7.7%) | 0 to 200 km | Can the carrier evidence its backhaul from network data? |
| Labour base | German driver | DE vs CEE base | Which establishment and posting rules does the offer assume? |
| Margin | 4.8% | 3% to 8% | Is margin taken on cost or on revenue, and what does it cover? |
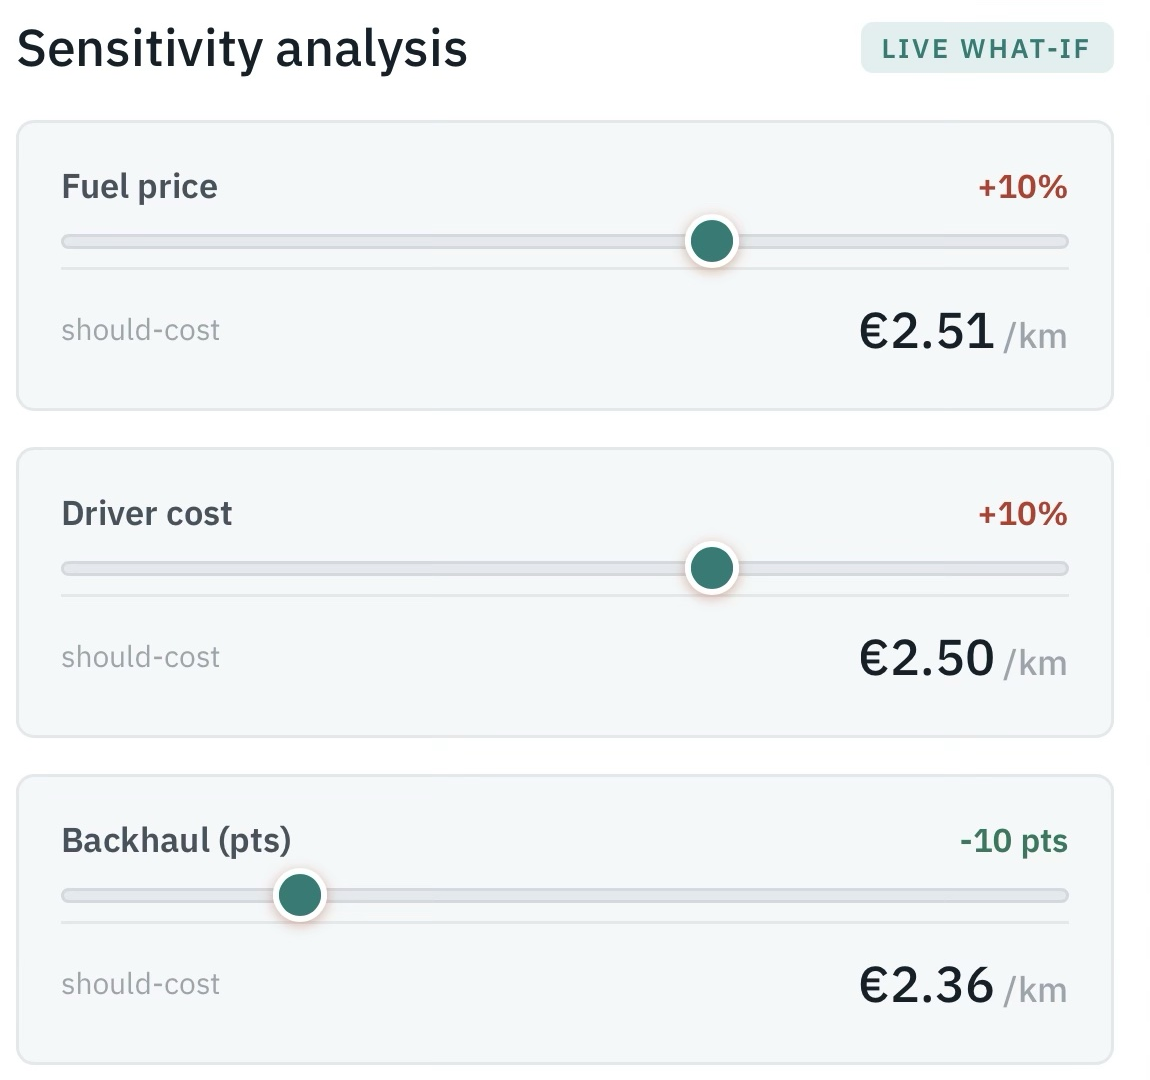
Fuel and driver cost are the two inputs that move the result most, and they move it by €90 and €78 a trip respectively at a 10% shock. Stacked together they take the should-cost to roughly €3,090 — still 22% below Carrier 4. Put the other way round: to justify €3,950 on cost alone, the fuel bill for the trip would have to more than double.
What does the waiting time actually cost?
| Component | Hours | Cost |
|---|---|---|
| Waited / free allowance | 5.0 h / 2.0 h free | — |
| Paid driver time | 3.0 h | €107 |
| Vehicle holding (asset committed, not moving) | 3.0 h | €34 |
| Idling fuel | 3.0 h | €13 |
| Detention cost | 3.0 h chargeable | €155 |
Five hours were waited on this lane: border formalities, congestion around the conurbations and dwell at the Channel terminal. Against a two-hour free allowance, three hours are chargeable, and at the model's own rates those hours are worth €155 — about €52 an hour, or 5.3% of the trip cost.
Carrier 4's premium is 6.6 times that figure. If the premium really is a dwell contingency, it belongs in a detention clause with a defined free period and an hourly rate — not buried in the linehaul, where it is charged on every load whether the delay happens or not. On 100 loads a year, three chargeable hours are €15,500.
What does the lane cost per pallet?
| Unit | At should-cost | At highest quote |
|---|---|---|
| Cost per pallet (33 pallets) | €88.53 | €119.70 |
| Cost per m³ (100 m³) | €29.21 | €39.50 |
| Cost per kg (24 t payload) | €0.122 | €0.165 |
| CO₂ per trip | 1,041 kg | 1,041 kg |
| CO₂ per pallet | 31.5 kg | 31.5 kg |
A €31 difference per pallet, or €1,029 a load, before service levels have been discussed at all. Emissions come from the same routed distance and consumption model as the cost, so the cost case and the carbon case cannot drift apart.
Five questions to take into the carrier meeting
- Which labour-cost base, establishment country and operating schedule does the offer assume?
- Which crossing, loading and waiting allowances are already priced into the linehaul?
- What empty-running or backhaul exposure is specific to this lane, and what network evidence supports it?
- Which items should be fixed, which indexed, and which treated as verifiable pass-through?
- At what point does detention start, at what hourly rate, and who books and owns the Channel crossing?
A should-cost result is a decision anchor, not a price ceiling. Market imbalance, capacity, service conditions and carrier network economics can all justify a rate above the model. The purpose is not to drive every quote down to cost — it is to know precisely how much of a quote the carrier is being asked to explain, and to stop paying for assumptions nobody ever stated.
Method and scope
Figures are produced by the Frintelis should-cost engine from operator-entered lane inputs and a frozen European reference set covering fuel, labour, toll, asset, maintenance and overhead cost. Routing is OpenStreetMap / Valhalla on a truck profile. The model is deterministic: identical inputs return an identical result, and every element in the total is traceable to a stated input. Toll figures are shown net of VAT. Carrier quotes are reproduced as received and the carriers are anonymised.
This is a cost model, not a market price index. It does not observe transacted rates and it does not forecast them. It answers a narrower and more useful question: on this lane, with this equipment and these operating assumptions, what does the work actually cost?
Need this for your own lanes?
Two ways to use it, depending on whether you want the tool or the work done.
1 — Frintelis, the platform
Model your own lanes, run sensitivity testing, export briefs like this one for your tender file. Currently in an invitation-only pilot.
2 — Advisory: tender and cost-model support
Independent support for European road freight procurement, delivered by the person who built the engine behind these notes.
Gyorgy Sike — twenty years in logistics network design and transport category management across European manufacturing. Currently responsible for transport strategy and cost transparency across a 30+ site European production network. Previously Global Logistics Category Manager at Norsk Hydro's extrusion business, running tender programmes delivering 13–21% cost reduction across five European markets — and where the first road freight TCO models behind Frintelis were built. Earlier network design and lowest-landed-cost modelling at iQor and Jabil, covering forward and reverse flows across Europe and the Americas. MSc Economics (international trade and the EU), University of Miskolc.
- RFQ and tender support — should-cost positions for your lane set before quotes come in, and a structured read of the field once they do.
- Cost model build — a bespoke should-cost or cost-to-serve model for your network, equipment mix and labour bases, handed over so your team owns it.
- Budget and rate forecasting — cost-driver-based planning figures for the coming budget year rather than last year's rate plus an index.
- Quote review and negotiation preparation — element-by-element reconciliation of carrier offers, and the questions that hold up in the room.
- Carrier portfolio and tendering frameworks — governance, evaluation structure and benchmarking for fragmented multi-site networks.
Scope. Road freight, Europe. Full truckload and groupage, multi-site manufacturing and distribution networks. Not ocean, air or parcel.
Independent. Not a 4PL, not a broker, no carrier commissions and no revenue share on savings. The only thing being sold is the analysis.
Engagements are scoped to a single tender cycle or a defined lane set, remote across Europe. Working languages: English and Hungarian, German at working level. Get in touch and we can work out whether it fits.